BD CBA Analysis Software
Built for BD Biosciences
BD still distributes the software years after delivery. It's the free alternative to FlowJo's paid CBA plugin, making it the default for many researchers.
My second engagement with BD Biosciences. They had a licensed third-party tool for analyzing cytometric bead array (CBA) data, and that license was expiring. CBA is a multiplexed immunoassay technique (it measures multiple proteins in a single sample). BD needed their own replacement before the deadline, and they needed it to be better than what they had. Years later, BD still distributes the software on their website. The only alternative for CBA analysis is a FlowJo license plus their CBA plugin. BD’s tool is free with a BD account, which makes it the default choice for many researchers running CBA assays.
The Analysis Pipeline
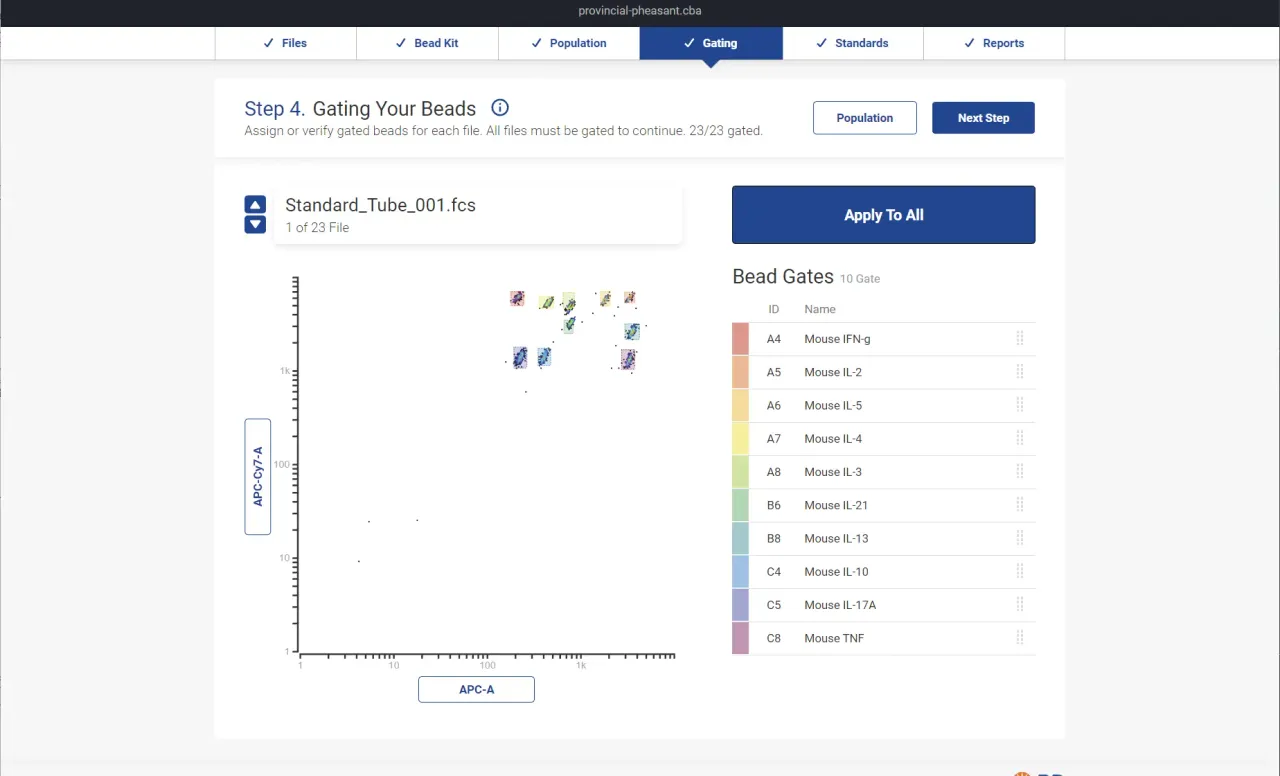
The previous workflow was fragmented: export from the instrument, import into separate software, run manual steps, export again. I built a single desktop application that handles the full pipeline in six steps.
FCS file import reads flow cytometry standard files (versions 2.0 through 3.1) and auto-sorts them to detect which are standards and which are samples. Drag and drop a folder of .fcs files and the software figures out what it’s looking at.
Bead Kit Templates let researchers define reusable kit configurations for BD CBA Kits and Flex Sets. Each template specifies which analytes are in the kit, their bead positions, and the expected concentrations for standard curves. Set it up once, reuse it across experiments.
Population definition uses a FlowGrid clustering algorithm to automatically gate bead populations and filter debris out of the data. Researchers can adjust gates manually, but the automatic detection handles the common case without intervention.
Analyte gating presents an interactive scatter plot where each bead population gets color-coded by analyte assignment. If the automatic assignment is wrong, researchers drag a population to reassign it. This was one of the biggest UX improvements over the previous software, where gating was entirely manual.
Standard curve fitting runs per-analyte regression with the researcher’s choice of model: Linear, Polynomial, Exponential, Power, 4-Parameter Logistic, or 5-Parameter Logistic (Hill equation). The regression engine uses Levenberg-Marquardt optimization under the hood. D3.js renders the curves interactively so researchers can see how well the fit matches their data and switch models on the fly.
Reporting provides three views of the results (by analyte, by sample, or by replicate) and exports to PDF or Excel. The goal was to get researchers from raw instrument output to a report they could hand to a collaborator without ever leaving the application.
Technical Details
It’s an Electron application with a CI/CD pipeline producing signed artifacts for Linux, Windows, and Mac. Experiments persist in a custom .cba file format so researchers can save their work, reopen it later, and pick up where they left off. The application includes an auto-update mechanism for deploying new versions.
I was the Principal Software Engineer and Lead Developer on this project from August 2021 through January 2022. I wrote about 90% of the codebase. A second developer contributed UI work for roughly two months. I gathered requirements directly from BD’s research scientists, created the project plan, and made the architectural decisions.